You update a plugin, refresh the page, and your site is just… white. No error, no menu, nothing. This is the famous WordPress “white screen of death”, and in most cases it is caused by a PHP fatal error that WordPress is hiding from visitors.
The good news: the fix is usually quick once you know which plugin, theme or file caused it. Here is the process we follow.
1. Check your email for a recovery link
Since WordPress 5.2, fatal errors trigger recovery mode. WordPress emails the site administrator a special link that lets you log in with the broken plugin or theme paused. If that email arrived, use it first. It is the fastest route back in.
2. Turn on debug logging
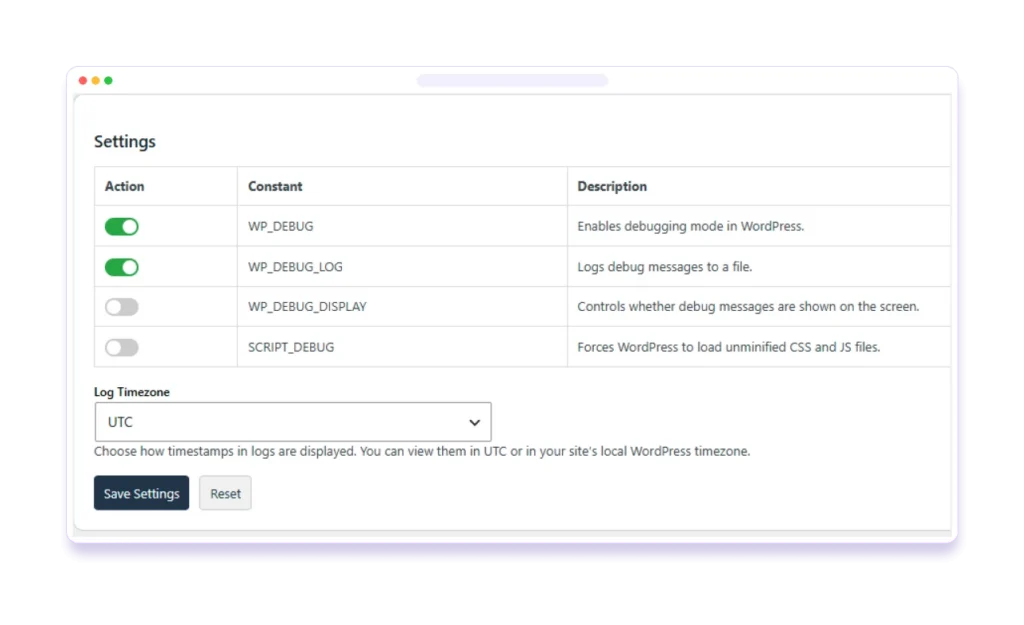
If there is no email, turn on logging so the error is written to a file instead of disappearing. Add these lines to wp-config.php, above the line that says “That’s all, stop editing!”:
define( 'WP_DEBUG', true );
define( 'WP_DEBUG_LOG', true );
define( 'WP_DEBUG_DISPLAY', false );
Reload the broken page once. WordPress will now write errors to wp-content/debug.log without showing them to visitors.
3. Read the last fatal error
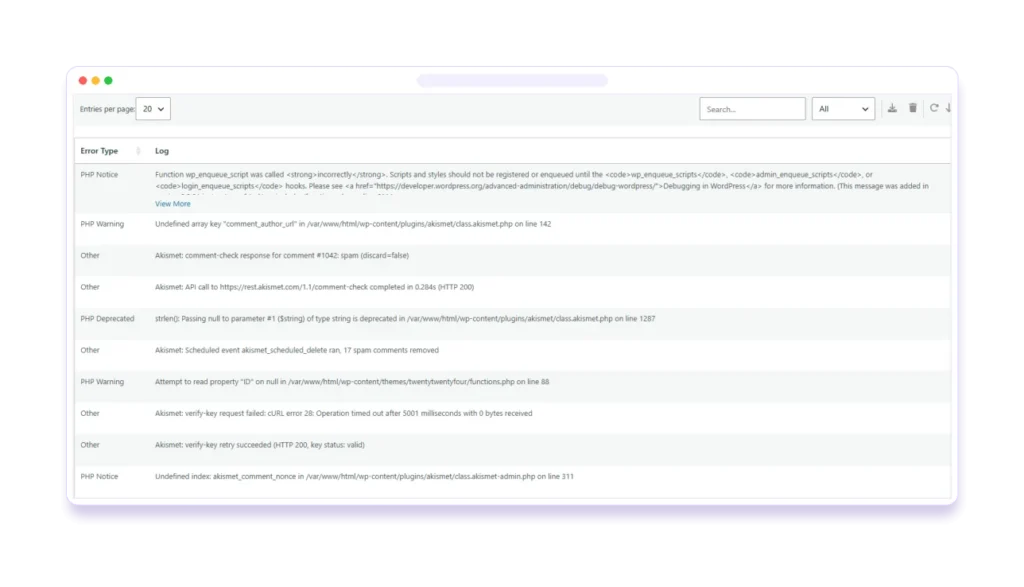
Open debug.log and scroll to the bottom. Look for a line that starts with PHP Fatal error. The file path in that line tells you who is responsible, for example /wp-content/plugins/plugin-name/… or /wp-content/themes/theme-name/….
4. Deactivate the plugin or theme that caused it
- If you can reach wp-admin, deactivate the plugin from the Plugins screen.
- If you can’t, rename its folder over FTP or your host’s file manager, for example
plugin-name→plugin-name-off. WordPress will deactivate it automatically. - For a theme, rename its folder and WordPress will fall back to a default theme.
5. Rule out the memory limit
If the log says Allowed memory size … exhausted, the site ran out of PHP memory. You can raise the WordPress limit in wp-config.php (your host may cap it):
define( 'WP_MEMORY_LIMIT', '256M' );6. Switch debugging off again
Once the site is back, set WP_DEBUG to false. Leaving debug mode on a live site can expose information and fill your disk with log entries.
Tip: once you can log in again, BugTrace lets you switch these debug settings on and off from the dashboard, read
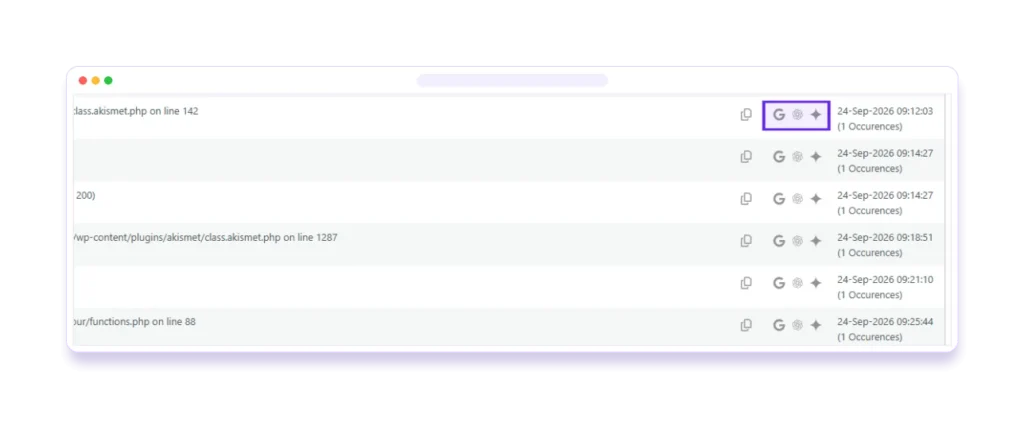
debug.logwithout FTP, and search any error on ChatGPT, Gemini or Google in one click.